Planning network investment as DER adoption grows
Published on July 13th, 2026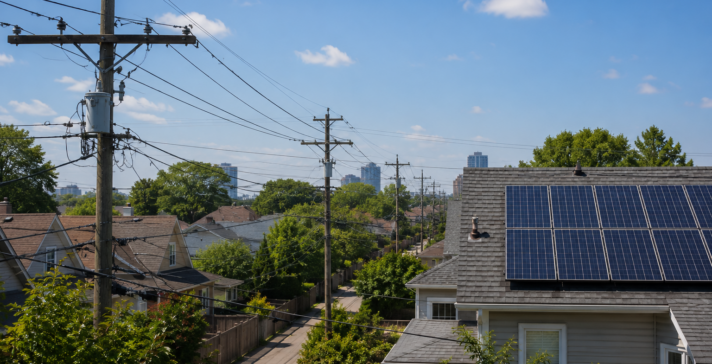
Distributed energy changes the shape of the load-flow problem, not just the width of its error bars. A system-average forecast can’t tell you where it defers investment and where it forces it.
For most of the last century, the distribution network had one job in one direction. It moved power from the substation to the customer. Distributed energy resources quietly ended that. Rooftop solar, behind-the-meter storage, EV chargers and the management systems coordinating them (DERMS) have changed the edge of the grid. That edge now both consumes and produces, on a schedule no historical load curve predicted.
The reflex in many planning rooms is to treat this as a forecasting problem with a wider error bar. From an asset-management standpoint, it isn’t. It’s a change in the shape of the problem, and in the resolution at which you have to model it. A wider error bar still assumes the same underlying load duration curve. DERs break the curve itself. They decouple a feeder’s net demand from the weather, the time of day, and each other. An aggregate forecast cannot represent that behaviour.
The same megawatt can defer investment or force it
Here’s the uncomfortable part: a distributed resource is not inherently good or bad for your capital plan. Sited and integrated well, a cluster of DERs can defer or eliminate a reinforcement. The load it offsets is load you no longer have to build for. The deferral itself has quantifiable value. Money has a cost. Pushing a reinforcement out by several years therefore carries a present-value benefit. You can put that benefit on the books before a single new asset is installed.
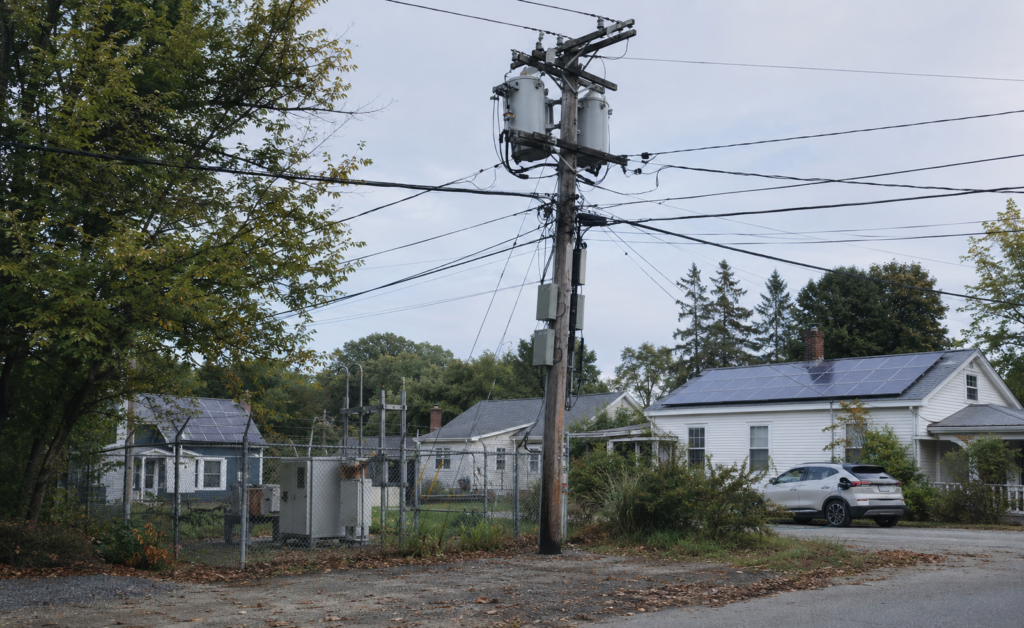
Sited poorly, the same resources do the opposite. Behind-the-meter generation can drive reverse power flow through assets and protection schemes designed for one-directional flow. Concentrated PV can push feeder voltage above statutory limits in the middle of a low-load afternoon. And clustered EV charging can create localised thermal loading, forcing a reinforcement you would not otherwise have needed. The identical megawatt of solar is an asset on one feeder and a liability on the next.
The identical megawatt of solar is an asset on one feeder and a liability on the next.
The deciding factor is rarely the quantity of DER on the system. It’s where it lands relative to existing headroom, and how the network beneath it behaves hour by hour. That is precisely the resolution most planning models don’t operate at. They were built to answer “how much demand, and when does it peak”. Not “what is the voltage at the end of this feeder at 2pm on a sunny Sunday when half the connections are exporting.”
Why aggregate forecasts quietly mislead
A top-down forecast can tell you that DER adoption across a service territory will reach some percentage by some year. What it cannot tell you is which substations gain headroom and which feeders breach their hosting-capacity limit first. Nor can it tell you where a connection request will clear and where it will trigger a reinforcement. Those answers live in the physical constraints: thermal ratings, statutory voltage bands, fault levels, protection coordination, and reverse-flow limits. These constraints only resolve when you model the network from individual assets and circuits upward, with real topology and impedances. A system average, worked downward, discards them.
Hosting capacity is the clearest example of why the average lies. It is not a single territory-wide number. It is a per-feeder, sometimes per-node quantity, governed by whichever constraint binds first. That could be voltage rise on a long rural radial or a thermal limit on a loaded urban feeder. It could also be the fault level near the substation. Two feeders carrying identical nameplate DER can sit on opposite sides of their limit because their length, loading and topology differ. A connectivity-aware, power-flow-based model captures that. An average discards exactly the spatial information that determines the answer.
Plan from the average and you make one of two expensive mistakes. You overinvest in reinforcement the DERs would have rendered unnecessary, sinking capital into capacity distributed generation was already providing. Or you underinvest and discover the binding constraints only after they surface as voltage complaints and outages. At that point the remedy is reactive, urgent and far dearer than the planned alternative.
The leadership question underneath the technical one
What executives are really asking isn’t “how much DER is coming.” It’s “how does this change what I need to build, and when can I avoid building it?” That reframing matters. The upside of getting DER integration right isn’t only reliability, it’s the capital you defer or never spend.
The discipline that unlocks it is treating avoided investment as something you quantify and defend, not merely hope for. If storage on a constrained feeder lets you postpone a reinforcement, that deferral has a net present value that belongs on the same risk-and-return footing as every conventional build in the plan, rankable, comparable, and justifiable to a regulator alongside the steel it displaces. Distributed resources stop being a nuisance to absorb and become a planning asset to position.

So how do you tell the asset from the liability?
Getting there requires asset models that are genuinely DER-ready: built to evaluate hosting-capacity headroom, reverse-flow and voltage-rise scenarios, and the time-varying behaviour of the edge, not just annual peak growth. The networks treating DER as an analytical opportunity rather than an operational headache are the ones finding capital they didn’t know they had, by modelling from the asset up, where the value actually hides.
How Direxyon does this. Where most tools produce a single deterministic projection, Direxyon models the uncertainty explicitly and does so from the asset up, not from the system average down. Feeder-level hosting-capacity, reverse-flow and voltage-rise scenarios are encoded into a decision twin that reflects each feeder’s actual topology, thermal rating, and DER adoption profile. Those scenarios are then run through Monte Carlo simulation across the full portfolio, so each integration strategy yields a distribution of probable outcomes rather than one forecast that will inevitably be wrong. The output includes the present value of a DER-enabled reinforcement deferral with confidence intervals you can put on the books and defend before a regulator and a clear ranking of which feeders represent genuine capital-deferral opportunities versus which ones will require reinforcement regardless of how optimistically the DER is positioned.
This is the second of five strategic questions we examine in Aiming True, our 2026 analysis of capital investment for electrical networks. The chapter includes the feeder-level hosting-capacity scenarios behind these claims, voltage-rise and reverse-flow thresholds, and a worked example quantifying the present value of a DER-enabled reinforcement deferral.
→ Read the white paper: Aiming True: An analytical approach to capital investment
Frequently Asked Questions
The same megawatt can defer a reinforcement on one feeder and force one on another. The value depends on where it lands relative to existing headroom, not how much there is. In other words, siting and integration decisions, not volume targets, determine which side of that line each feeder lands on.
Anything that generates, stores or actively manages energy on the customer side or the distribution side of the grid: rooftop and community solar, behind-the-meter batteries, EV chargers, smart water heaters and demand response programs. In short, the label covers loads as well as generators, because a managed EV charger changes a feeder’s behaviour just as much as a solar panel does.
The amount of DER a feeder can accept before a constraint, voltage, thermal or fault level, binds. It’s a per-feeder, sometimes per-node figure, not a single territory-wide number. Consequently, mapping it feeder by feeder is the first step in knowing where new connections can clear without triggering a reinforcement.
Yes, largely. Non-wires alternatives (NWAs) are the programs utilities run when well-sited DERs or demand response can defer a conventional build. Indeed, the analysis in this article is the homework behind a credible NWA: you can only propose one if you can show, feeder by feeder, where the deferral is real.
Well-sited DER can defer or eliminate a reinforcement, and that deferral carries a quantifiable present-value benefit you can put on the books. In fact, quantifying that deferral and ranking it against conventional builds is a core function of modern capital planning software.
A distributed energy resource management system (DERMS) is the software layer that monitors and coordinates rooftop solar, storage and EV charging across a network. In practice, it changes what the edge of the grid does hour by hour, so planners need to build DER behaviour into capital planning rather than bolt it on afterwards.
Less than most utilities fear. Network topology and impedances from GIS, asset ratings, and whatever interval data exists from AMI or SCADA form the starting point. Gaps are normal; therefore, good models quantify the uncertainty that missing data creates rather than waiting for a perfect dataset that never arrives. Moreover, a platform designed for electric networks can start with the data you have and sharpen the model as coverage improves.
A traditional forecast projects annual peak demand from a system average and asks how much capacity to add. In contrast, DER planning asks where headroom already exists and where it is about to run out, so it requires hour-by-hour modelling at the feeder level rather than a wider error bar on the same curve.
Let us show you how it works
Our product specialists will walk you through our proven approach to enhance your capital investment planning.

Explore resources

 Blog
BlogThe Question Behind Every Infrastructure Budget
Read more : The Question Behind Every Infrastructure BudgetEvery infrastructure budget comes down to one question, asked two ways: what a target level of service costs, and what a fixed budget can achieve.
 Blog
BlogPowering growth without overburdening ratepayers
Read more : Powering growth without overburdening ratepayersConnection requests now arrive in hundreds of megawatts. The hard question is who pays, and how to plan node by node before committing.
- Blog
Reliability and resilience in electrical network planning
Read more : Reliability and resilience in electrical network planningExpected value works for reliability and fails for resilience. A worked example shows how the risk measure you choose, not the investment, decides the capital plan.